Introduction:-
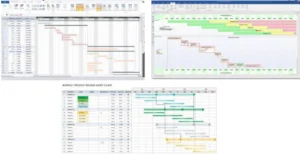
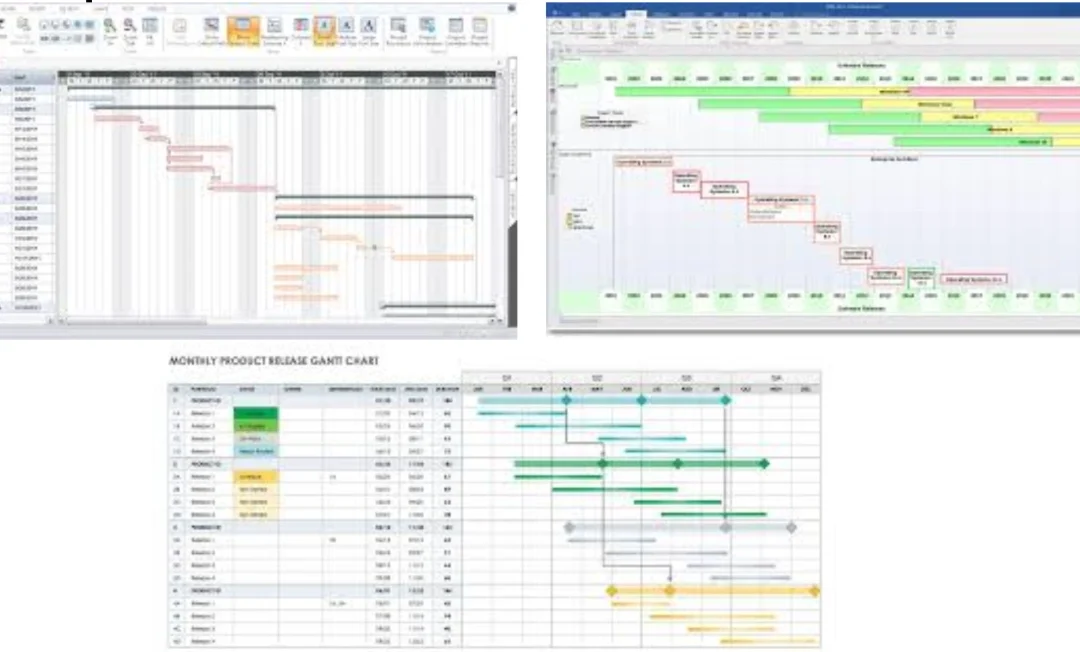
A Gantt chart is a visual tool that helps project managers plan and track a project’s progress. Henry Gantt designed and popularized the Gantt chart around 1910–1915. Gantt charts are often displayed as a bar chart, where each task is represented by a bar along a timeline.
Seven important elements of Gantt Chart are as follows:-
- Tasks, their duration, status, and priority.
- Start and end dates.
- Progress.
- Timeline with the time scale.
- Milestones.
- Dependencies between tasks.
- Deadlines.
- Critical path
Some ways Gantt charts are used:
- Managing milestones and deadlines
- Breaking projects into smaller tasks
- Visualizing task dependencies
- Monitoring project progress